Financial Highlights
Consolidated results and information per share for the last five fiscal years
Consolidated results
Our fiscal year (FY) is 1 April - 31 March period
| FY2021 | FY2022 | FY2023 | FY2024 | FY2025 | ||
|---|---|---|---|---|---|---|
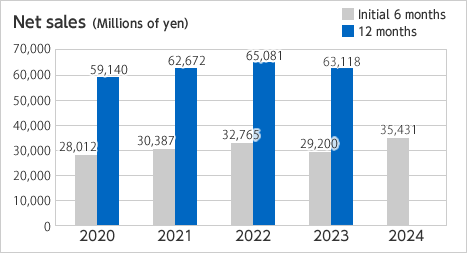
| Net sales (million yen) |
Initial 6 months | 30,387 | 32,765 | 29,200 | 35,431 | 37,611 |
| 12 months | 62,672 | 65,081 | 63,118 | 73,255 | ||
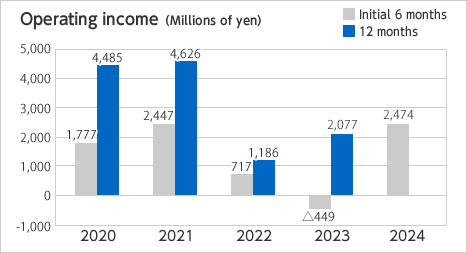
| Operating income (million yen) |
Initial 6 months | 2,447 | 717 | △449 | 2,474 | 3,868 |
| 12 months | 4,626 | 1,186 | 2,077 | 5,351 | ||
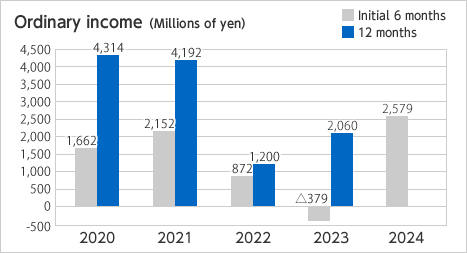
| Ordinary income (million yen) |
Initial 6 months | 2,152 | 872 | △379 | 2,579 | 3,603 |
| 12 months | 4,192 | 1,200 | 2,060 | 5,737 | ||
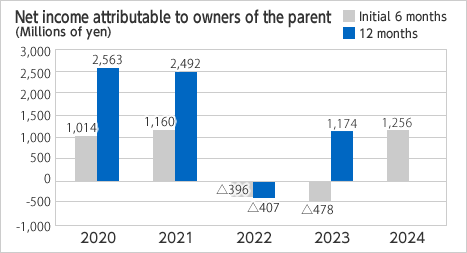
| Net income attributable to owners of the parent (million yen) |
Initial 6 months | 1,160 | △396 | △478 | 1,256 | 2,182 |
| 12 months | 2,492 | △407 | 1,174 | 2,585 | ||
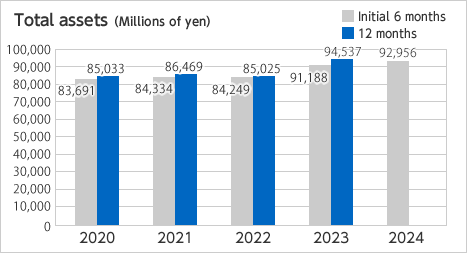
| Total assets (million yen) |
Initial 6 months | 84,334 | 84,249 | 91,188 | 92,956 | 102,398 |
| 12 months | 86,469 | 85,025 | 94,537 | 97,113 | ||
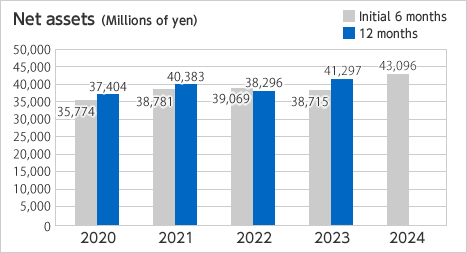
| Net assets (million yen) |
Initial 6 months | 38,781 | 39,069 | 38,715 | 43,096 | 51,974 |
| 12 months | 40,383 | 38,296 | 41,297 | 44,504 | ||
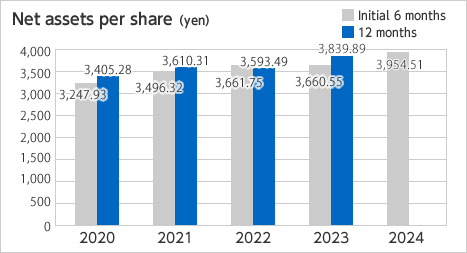
| Net assets per share (yen) |
Initial 6 months | 3,496.32 | 3,661.75 | 3,660.55 | 3,954.51 | 4,390.42 |
| 12 months | 3,610.31 | 3,593.49 | 3,839.89 | 4,044.52 | ||
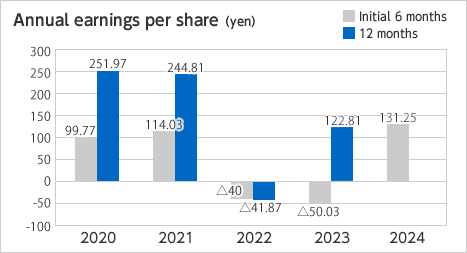
| Annual earnings per share (yen) |
Initial 6 months | 114.03 | △40 | △50.03 | 131.25 | 223.97 |
| 12 months | 244.81 | △41.87 | 122.81 | 270.08 | ||
- * The "Accounting Standard for Revenue Recognition" (ASBJ Statement No. 29, March 31, 2020) and relevant ASBJ regulations have been applied from the beginning of the fiscal year ended March 31, 2022. Each figure related to and after the fiscal year ended March 31, 2022 reflects this accounting standard.


